


Contact Us
Little House Capital
35 Braintree Hill Park
Suite 100
Braintree, MA 02184
Seeks to achieve reasonable income with the potential for capital appreciation. The investment portfolio aims to capture a dividend yield that exceeds the yield of the S&P 500 index and selects companies based on fundamental factors and underlying free cash flow metrics.
Risk-averse, value-oriented individuals seeking to accumulate steady and consistent income from their investment portfolio while maintaining US Large-Cap Exposure.
LHC’s investment team provides unique institutional-quality concentration toward large-cap compounders with demonstrated records of sustainable cash flow growth. Security selection consists of a multidimensional equity screening process coupled with top-down expertise that incorporates greater macroeconomic and industry themes. Both our allocation and selection processes are very methodical and focused on income generation and growth for clients while maintaining a low volatility profile. All stocks held offer a dividend yield. Use of dynamic portfolio reporting systems, proprietary databases, and Bloomberg Terminal Access allows our team to actively monitor and manage holdings with a high level of conviction.
| Structure | Separately Managed Account |
| Inception | 06-01-18 |
| Category | US Large Cap Value |
| Benchmark | 50/50 S&P 500 Russell 1000 Value |
| Holdings | 40-60 |
| Target Tracking Error | 3%-6% |
| Sector Deviation | +/-7% |
| Annual Turnover | 25%-50% |
| Initial Position Size | 0-5% |
As of 6/30/2026
| Sector | Rep. Account | Benchmark |
|---|---|---|
| Communication Services | 8.2% | 6.5% |
| Consumer Discretionary | 9.0% | 10.0% |
| Consumer Staples | 5.3% | 6.1% |
| Energy | 4.8% | 4.3% |
| Financials | 16.1% | 15.5% |
| Health Care | 9.4% | 10.8% |
| Industrials | 10.5% | 10.1% |
| Information Technology | 26.2% | 28.3% |
| Materials | 0.8% | 2.8% |
| Real Estate | 3.3% | 2.8% |
| Utilities | 4.3% | 3.1% |
| Security | Weighting |
|---|---|
| Taiwan Semiconductor | 6.5% |
| JPMorgan Chase & Co | 5.0% |
| Johnson & Johnson | 4.3% |
| Garrett Motion | 3.9% |
| ASML | 3.9% |
| Microsoft Corp | 3.8% |
| Alphabet | 3.8% |
| Apple | 3.7% |
| Broadcom | 3.1% |
| Walmart Inc | 2.9% |
| Characteristics | Portfolio | Benchmark |
|---|---|---|
| P/E – Forward 12M | 22.7x | 21.0x |
| Yield % | 1.9 | 1.7 |
| Avg. Market Cap ($B) | $942 | $756 |
| Beta | 0.86 | 1.00 |
| Standard Dev. | 10.9% | 12.1% |
As of 09/30/2023
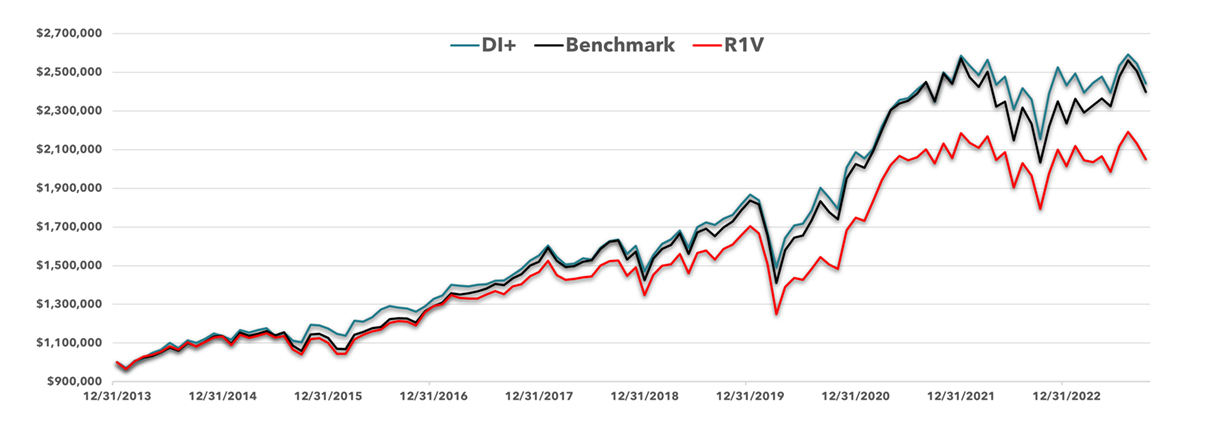
| Returns | 2015 | 2016 | 2017 | 2018 | 2019 | 2020 | 2021 | 2022 | 2023 |
|---|---|---|---|---|---|---|---|---|---|
| Dividend Income+ (Gross) | 4.7% | 13.8% | 17.7% | -4.4% | 28.0% | 12.9% | 24.0% | -5.5% | 0.6% |
| Dividend Income+ (Net) | 3.7% | 12.8% | 16.7% | -5.4% | 27.0% | 11.9% | 23.0% | -6.5% | -0.2% |
| R1000V SPX 50/50 | -1.2% | 14.6% | 16.7% | -7.0% | 29.0% | 10.6% | 26.9% | -12.8% | 7.4% |
| Russell 1000 Value | -3.8% | 17.3% | 12.7% | -8.8% | 26.5% | 2.8% | 25.1% | -7.6% | 1.8% |
Investment products and strategies are not guaranteed by Little House Capital LLC, are not insured by the FDIC or by any other government agency and may lose value. The information throughout this presentation is for illustrative purposes and is subject to change at any time. Holdings and sector weightings are subject to change and should not be considered investment advice or a recommendation to buy or sell a particular security. Actual holdings may vary by client. This information is supplemental to the GIPS Report. Performance returns of less than one year are not annualized. This managed account strategy involves risk, may not be profitable, may not achieve its objective, and may not be suitable or appropriate for all investors. Investors should consider the investment objectives, risks, and fees of this strategy carefully with their financial professional before investing. For legal and tax matters, legal and tax advisors should be consulted. All material is believed to be reliable, but accuracy is not guaranteed. This is not a warranty for liability on decisions based on such information. The S&P 500 and Russell 1000 Value are designed to be leading indicators of U.S. Equities and is meant to reflect the risk/return characteristics of the large cap universe. This is not a solicitation for any order to buy or sell securities. Copyright by Little House Capital.