


35 Braintree Hill Park
Suite #100
Braintree, MA 02184
Little House Capital, LLC
71 Elm Street
Worcester, MA 0160915 Constitution Drive
Suite 1A
Bedford, NH 03110
Individuals seeking global exposure to various asset classes, including individual equities and fixed income securities, as well as long-term capital appreciation.
Our Growth Maximizer Global strategy offers unique diversified exposure to domestic and international markets through a wide range of equity and fixed income products. Through carefully selected and well-researched emerging and developed market mutual funds, we can lessen a client’s dependence on U.S markets to capitalize on the growth of the global economy. The strategy’s allocation toward Absolute Opportunity+ allows for opportunistic, growth-oriented capital appreciation. Our well-structured Fixed Income allocation is blended across various maturities and sectors for optimal capital preservation. Our dynamic modeling portfolio management systems allow for investment models to automatically update across all client accounts to capture daily pricing actions.
For Accounts with assets over $500K you would expect to have the following holdings:
| Inception Date | 12-31-17 |
| Equity Benchmark | MSCI World Index |
| Bond Benchmark | 45% Corporates 45% Barclays Aggregate 10% Municipals |
| Total Holdings Range | 63-90 |
| Top 10 Holdings % | 25-40% |
| Initial Position Size | 0-5% |
Depending on a client’s investment objectives and attitudes toward risk, this strategy can be applied across a range of risk profiles to ensure the strategy helps a client reach his or her goals. Click to learn more about Risk Tolerance.
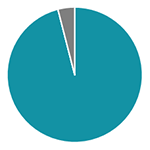
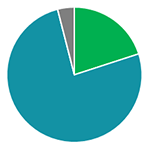
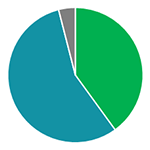
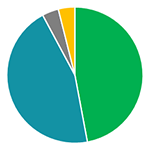
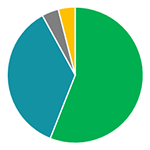
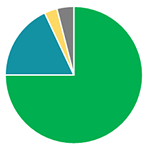
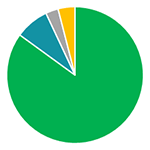
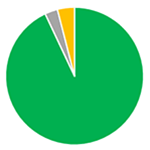
| Risk Profiles | Active Fixed Income | 20/80 | 40/60 | 50/50 | 60/40 | 75/25 | 85/15 | 95/5 | |||||||||||||||||||||||||||||||||||||||||||||||||||||||||||||||
|---|---|---|---|---|---|---|---|---|---|---|---|---|---|---|---|---|---|---|---|---|---|---|---|---|---|---|---|---|---|---|---|---|---|---|---|---|---|---|---|---|---|---|---|---|---|---|---|---|---|---|---|---|---|---|---|---|---|---|---|---|---|---|---|---|---|---|---|---|---|---|---|
| Equity | 0% | 20% | 40% | 46% | 56% | 75% | 85% | 93% | |||||||||||||||||||||||||||||||||||||||||||||||||||||||||||||||
|
|||||||||||||||||||||||||||||||||||||||||||||||||||||||||||||||||||||||
| Fixed Income | 96% | 76% | 56% | 46% | 36% | 18% | 8% | 0% | |||||||||||||||||||||||||||||||||||||||||||||||||||||||||||||||
|
|||||||||||||||||||||||||||||||||||||||||||||||||||||||||||||||||||||||
| Alternatives | 0% | 0% | 0% | 4% | 4% | 3% | 3% | 3% | |||||||||||||||||||||||||||||||||||||||||||||||||||||||||||||||
|
|||||||||||||||||||||||||||||||||||||||||||||||||||||||||||||||||||||||
| Cash | 4% | 4% | 4% | 4% | 4% | 4% | 4% | 4% | |||||||||||||||||||||||||||||||||||||||||||||||||||||||||||||||
 |
 |
 |
 |
 |
 |
 |
 |
||||||||||||||||||||||||||||||||||||||||||||||||||||||||||||||||