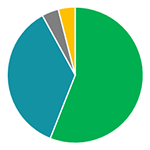
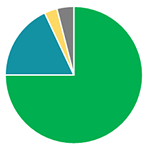
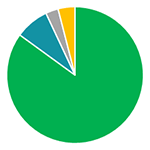
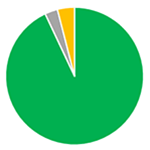
Risk Profiles
Strategic Weightings1
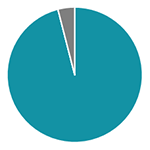
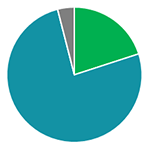
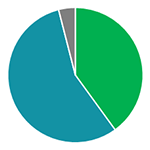
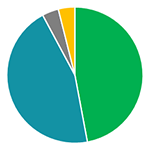
| Risk Profiles | Most Conservative | Conservative | Moderate | Balanced | Growth w/Income | Growth | Aggressive-Growth | Most-Aggressive |
|---|---|---|---|---|---|---|---|---|
| Equity | 0% | 20% | 40% | 48% | 56% | 75% | 85% | 93% |
| Bond | 96% | 76% | 56% | 46% | 36% | 18% | 8% | 0% |
| Alternatives | 0% | 0% | 0% | 4% | 4% | 3% | 3% | 3% |
| Cash | 4% | 4% | 4% | 4% | 4% | 4% | 4% | 4% |
 |
 |
 |
 |
 |
 |
 |
 |
Documents
Footnotes
1 – Strategic Weightings are benchmark weightings of the strategy performance and are used to monitor performance of the strategy. The investment team uses this as a starting point for each asset class.
2 – Tactical Drift is the allowable range the investment team can increase or decrease the weighting of that asset class and make active bets based on current market conditions and research.
3 – Dividend Income+ is a proprietary LHC capital US Large Cap value product that this strategy is anchored by. Learn more about this product here .